
4 min read

Our last article, Evaluating Your Clearinghouse: Are You Leaving Money on the Table, focused on breaking down exactly how a hospital could potentially save over 8 million dollars per year by getting two key measurements in line with the average customer on efficientC. (Hint: it’s all about the First Pass Yield (FPY) payment rate and denial write-offs as a % of NPR. Click the link above to learn more!)
In this article, we are going to dive deep into the idea that clearinghouse/claim scrubber performance can be improved by applying an active management strategy. A top-performing clearinghouse/claim scrubber requires continuous management and attention. If managed actively, the value it delivers can be greatly improved.
If left alone, however, this technology will simply go about its business potentially underperforming and putting more of your receivables at risk. That is why at efficientC we believe in being more than just a clearinghouse. We are also a dedicated claim management and an active denial prevention partner.
Performance Tracking - Denials by Category
To understand how well your clearinghouse is performing, it can help to look at a breakdown of your denials over the past few months by category. For example, below is an impact model based on a real healthcare organization’s denied claims.
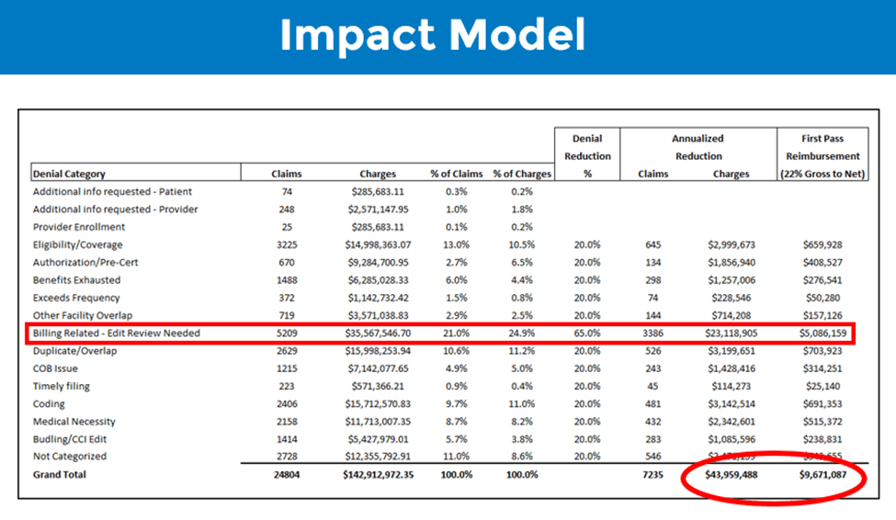
Based on the results in this model, if this customer actively managed their claim scrubber, they could reduce the number of denials by at least 7000 claims annually. This would result in over $43 million of denial reduction on an annual basis and improved first pass reimbursement of over $9 million annually. That means a significant improvement to A/R by getting more claim
s paid on first submission and a potential reduction in overall denial write-off percentage (efficientC customers average less than 1% on their denial write-offs).
The highlighted ‘billing related – edit review needed’ category is a proprietary category in efficientC that identifies denials that could be prevented with an edit. efficientC’s Insights analytics, uses machine learning to help identify denials that fit into this category. This target category is a key reason customer’s using efficientC achieve a higher FPY and lower denial write-offs.
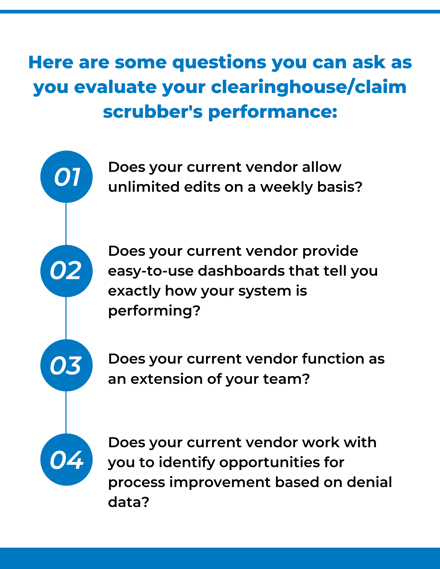
If your clearinghouse/claim scrubber partner offers data at this level of detail, focus on your largest denial categories (claim volume and dollars). Are you and your vendor partner doing everything possible to reduce these denials and maximize revenue in these areas? If the answer is “no,” work with your vendor to implement a more active denial prevention strategy.
If you would like to see how well your clearinghouse is performing, efficientC can create an impact model of your organization’s denials. If you’re interested, just click here to get in touch with our team today!
efficientC's Active Partner Model
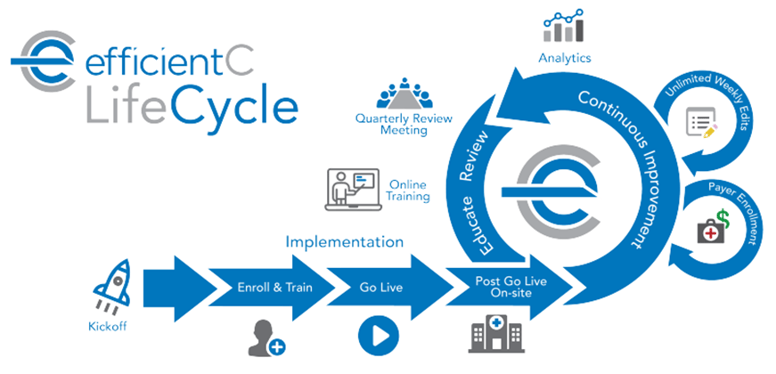
efficientC employs an active partner model. This means that our team of analysts is active working together with your team to ensure improved results. Our goal is to stop claims before they become a denial. In the long term, this reduces touches and improves your FPY. Our analysts regularly monitor all our customers denial data and will reach out when a potential issue is detected and help deploy the appropriate solution. This active partnership includes unlimited edits and automated payer enrollments. By staying in front of potential issues and focusing on stopping claims before they deny, we generate more revenue and save time by reducing denials that need to be touched.
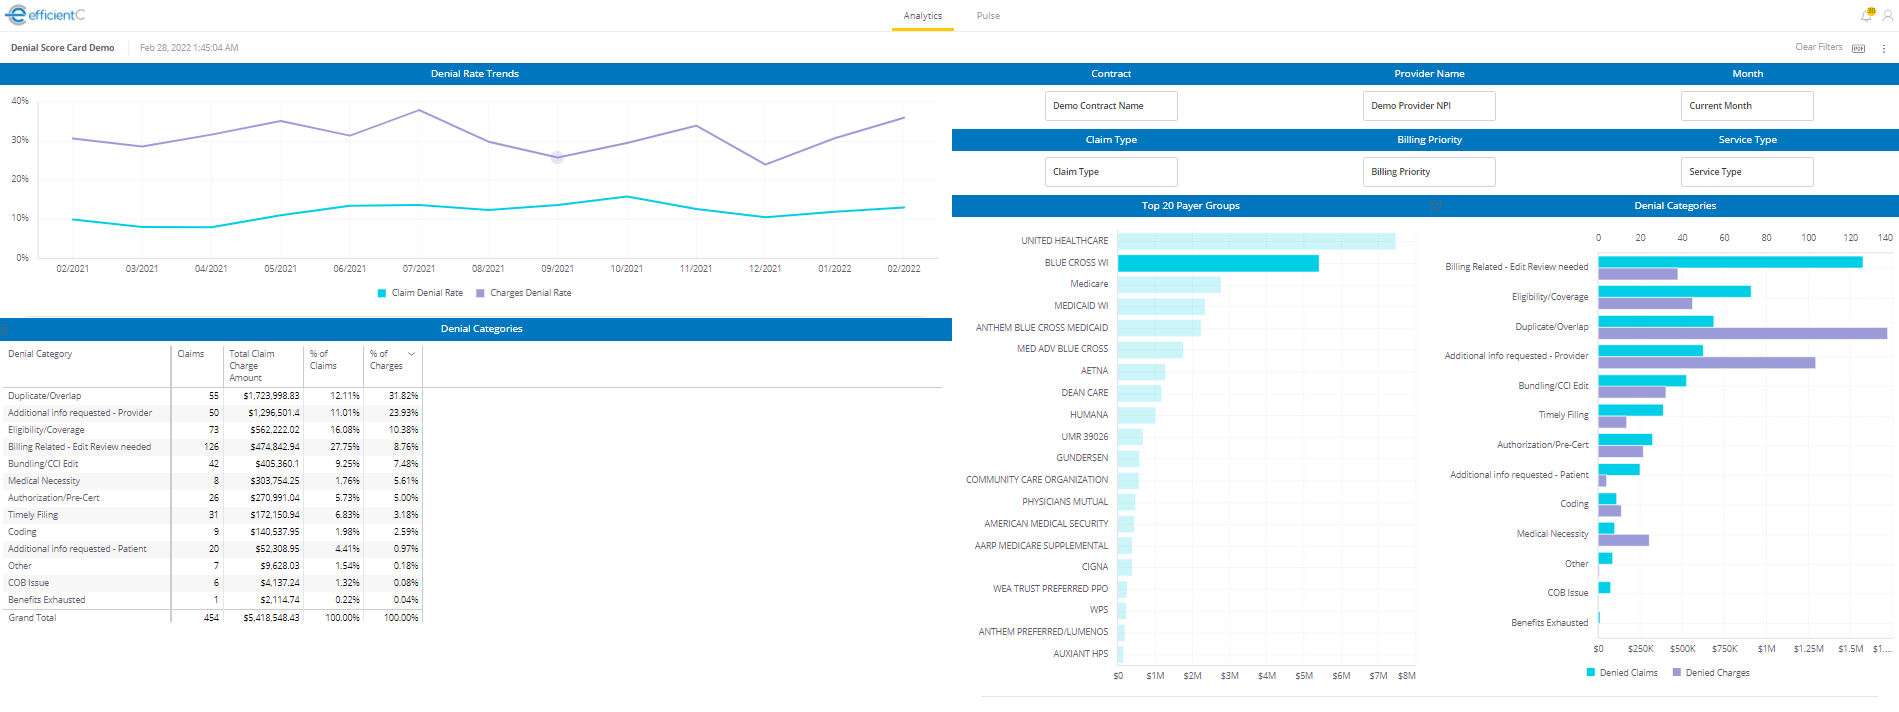
Regardless of the service model used by your clearinghouse partner, it is vital that your organization plays an active role in data monitoring and denial prevention. A good partner should be able to provide you with reporting and analytics that are easily accessible and simple to use. For example, below are a couple of dashboards available to efficientC customers.
-PNG.png)
By keeping a close eye on denials by category, your team will receive valuable insight into the changes you can make to achieve the greatest impact. For example, if medical necessity denials make up a large portion of your total denials, you can focus improvement efforts in that area.
Play an Active Role in Your Partnership
The bottom line is that you need a partner who cares about denial prevention as much as you do. Contact us today to speak with our billing experts and find out whether you might be leaving money on the table.
We offer a free denial analysis where we can take copies of your claim and remittance data to create an Impact Model that will show you how your current claim scrubber compares to the efficientC claim scrubber.
For more about our free denial analysis: go here.
Do not forget to subscribe to Revenue Cycle Matters for healthcare billing best practices and industry tips!

Related Posts
Discussion of Claim Integrity Task Force Report
With the recent release of the report from HFMA’s Claim Integrity Task Force: Standardizing denial...
Denial Madness Tournament Bracket Update - And Then There Were Four
Well, we’re down to the last four denials (just like that other tournament). If you haven’t been...
Measuring the Cost of Denials and the Impact of Prevention
When it comes to denial management, there is no “one-size-fits-all” approach.
Different...